A data analyst collects, checks and interprets data to help people make decisions. A data analyst job description commonly includes querying datasets, maintaining reports, investigating changes in performance and explaining findings to colleagues who may not have a technical background.
The role is broader than producing charts. Employers need someone who can recognise when a number is unreliable, ask a better question and explain what the evidence does or does not support. This guide focuses on those responsibilities and how to demonstrate them when applying.
What Occupational Guidance Reveals About Analytical Work
The US Department of Labor’s O*NET business intelligence analyst profile includes querying information, generating reports and maintaining analytical tools. Business intelligence overlaps with many data analyst roles, although the titles are not interchangeable in every organisation.
Use this as context for reading the vacancy, not as a requirement to master every listed technology. The employer’s data, decisions and reporting responsibilities determine the actual role. Our job roles guide helps connect that scope to the evidence a hiring team may need.
Data Analyst Job Description: Core Responsibilities
Define the Question and the Metric
Analysis starts with a decision someone needs to make. A request to explain falling sales might mean fewer orders, lower revenue, reduced margin or a different customer mix. Agreeing the question early prevents a technically correct analysis from answering the wrong problem.
Metric definitions should specify the population, time period and calculation. For example, an active customer might mean someone who logged in, made a purchase or renewed a contract. These definitions produce different numbers, so the analyst records the meaning before comparing results across teams.
Query, Combine and Validate Data
Analysts retrieve data from relevant sources, often using SQL, spreadsheets or approved reporting tools. They check whether joins create duplicates, whether dates use consistent time zones and whether cancelled records should be included. Small decisions at this stage can change the final result substantially.
Validation includes comparing totals with a trusted reference and investigating unexpected gaps. Missing values are not always zero, and an absent event can mean a tracking failure. The analyst should document these limitations rather than silently cleaning away evidence that the collection process needs attention.
Investigate Patterns and Competing Explanations
A useful investigation separates the overall change into meaningful groups, such as customer type, product or acquisition channel. An average can conceal differences between groups. The analyst looks for explanations that fit the evidence and tests whether a change in composition could account for the pattern.
A relationship between two measures does not establish cause. If customer satisfaction rises after a new process launches, other changes may also matter. The analyst distinguishes observation from causal evidence and recommends a suitable follow-up test when the decision requires stronger confidence.
Communicate Findings and Maintain Reports
Charts should make comparisons easy to understand, with clear labels, units and time periods. A useful explanation leads with the finding, connects it to a business decision and states the main limitation. Large dashboards can become less useful when every measure appears equally important.
Recurring reports also need ownership. Definitions, refresh schedules and known limitations should be documented so another person can maintain the work. When a source changes, the analyst checks whether the report still means what users think it means instead of simply fixing the visible error.
Data Analyst Skills and Qualifications
Technical Skills in Context
SQL helps retrieve and summarise structured data. Spreadsheets support quick checks and smaller models, while tools such as Power BI or Tableau help communicate repeatable views. Python or R may be useful for larger analyses, automation or statistical work, depending on the employer’s environment.
Tool lists should be read alongside the tasks. An analyst preparing operational reports may need different depth from someone evaluating experiments. Show the reasoning behind your choice of method, including why a simpler approach was sufficient when it answered the question reliably.
Statistical Reasoning and Communication
Practical statistical literacy includes understanding distributions, sampling, uncertainty and the difference between absolute and percentage changes. You should be able to explain why a small sample warrants caution and why a dramatic percentage may come from a very small starting value.
Employers may prefer degrees in quantitative or related fields, but requirements vary. Relevant work samples can demonstrate applied skill, especially when they explain the question, data checks and limitations. A polished chart with no account of how the data was prepared provides much weaker evidence.
Reporting Lines and Related Analytical Roles
A data analyst may report to an analytics manager, functional leader or business intelligence team. Ask who sets priorities, who owns the source data and who acts on the findings. An embedded analyst supporting sales may work differently from one serving several departments centrally.
A business analyst often focuses on business needs, processes and requirements, although analytical work can overlap. Data engineering concentrates more on building dependable data infrastructure, while data science may involve deeper modelling or experimentation. Read the actual responsibilities rather than assuming all data titles mean the same thing.
If you are looking for your first role, our graduate data analyst career guide covers entry preparation and career routes. This job-description guide focuses on the work and evidence expected within the role across experience levels.
An Example of a Useful Analytical Decision
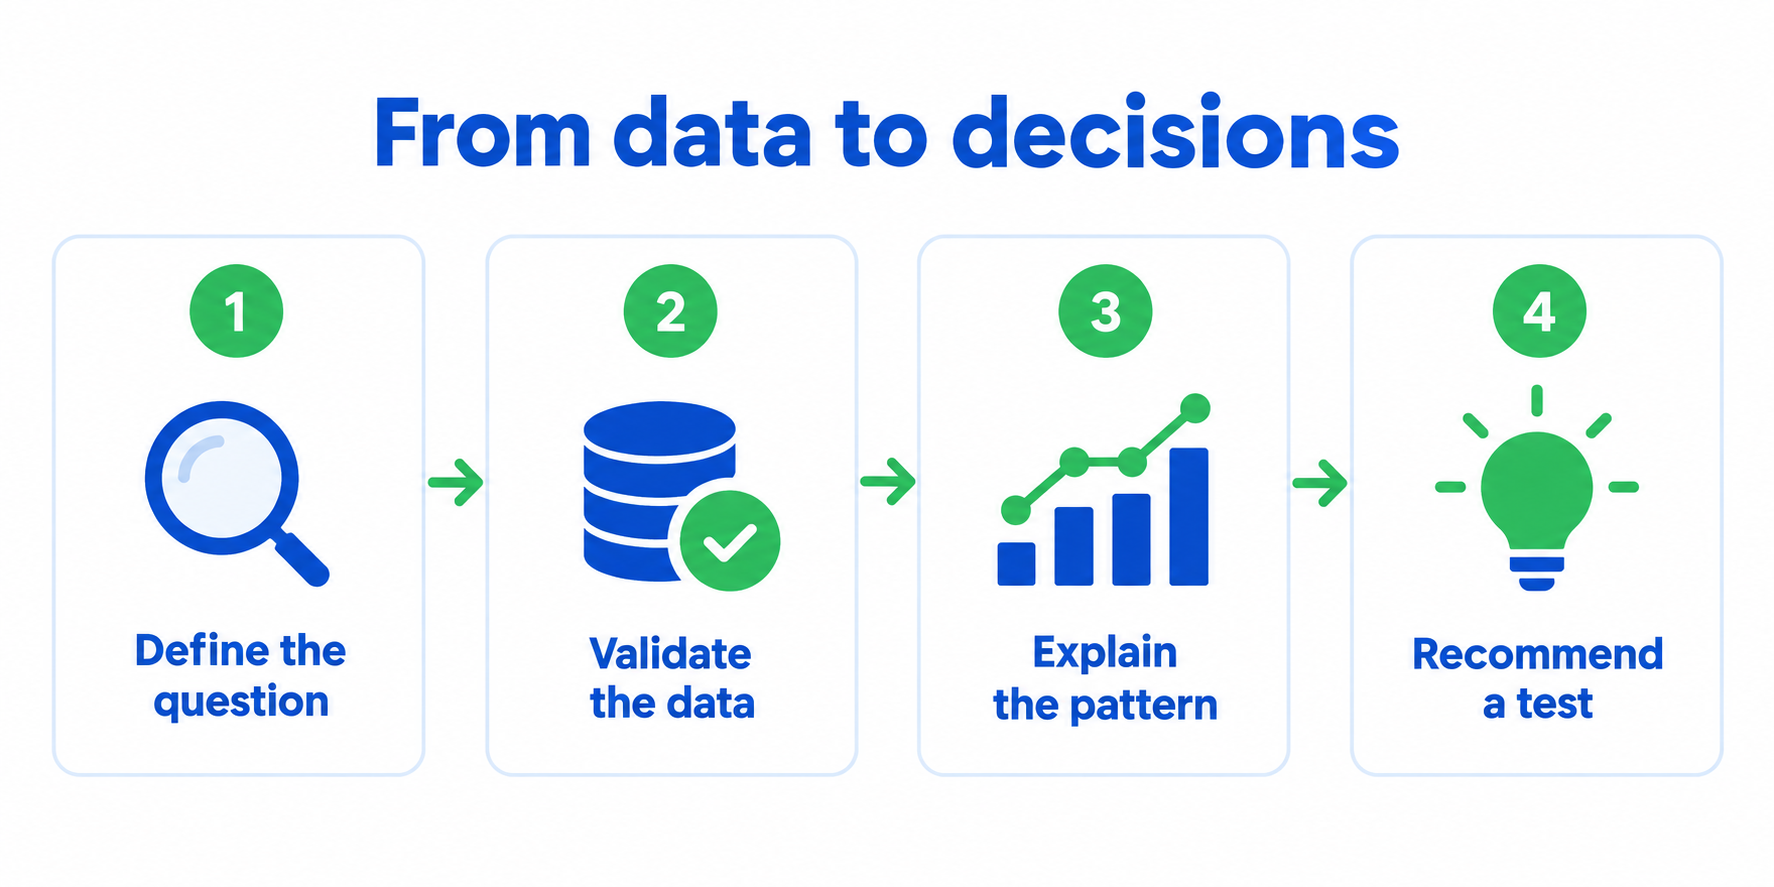
Consider a fictional online retailer whose conversion rate has fallen. Before recommending a website redesign, the analyst checks whether tracking changed, whether the denominator includes bots and whether the mix of traffic sources shifted. Each possibility could produce the same headline movement for a different reason.
Suppose the decline is concentrated in a new campaign attracting less relevant visitors. A useful recommendation could be to test audience targeting while monitoring revenue and customer quality. The analyst would explain why the evidence supports this next test without claiming to have proved the campaign caused every lost sale.
In a portfolio, show the query logic, validation checks and one readable chart. Use public or synthetic data when employer information cannot be shared. Label synthetic examples clearly so the viewer understands that the exercise demonstrates your method rather than a real commercial result.
How to Present Your Experience in an Application
Choose a project where your analysis changed a decision or prevented a mistake. Explain the stakeholder question, your method, the checks and the recommendation. If the organisation did not implement your recommendation, describe that outcome accurately rather than claiming an improvement you never measured.
Practise explaining the same example to a technical interviewer and a nontechnical colleague. Our tough interview questions guide can help structure the account around your judgement and learning. Be ready to discuss an assumption you would revisit with better data.
For a short introduction, follow the video resume guide. One simple explanation of a decision is more persuasive than quickly naming many tools. Keep any displayed dataset free of personal or confidential information.
Match Your Evidence to the Vacancy
Identify the decisions the employer needs help with, then select examples that show relevant analysis, communication and dependable delivery. Prepare questions about data access, report ownership and how recommendations are used. These details reveal whether the role fits your strengths.
Use Greetsquare for jobseekers to introduce your approach and connect it to a focused CV or portfolio. Aim to demonstrate that you can turn a question into trustworthy evidence and explain what someone should do next.
Frequently Asked Questions
Does Every Data Analyst Need Python?
No. Some roles rely mainly on SQL, spreadsheets and business intelligence tools, while others require Python or R for automation and deeper analysis. Read the tasks and required skills together. The ability to validate data and explain results remains important regardless of the software used.
Is a Data Analyst the Same as a Business Analyst?
The roles overlap, but their primary focus often differs. Data analysts investigate datasets and communicate evidence, while business analysts clarify needs, processes and requirements for change. Employers sometimes combine these responsibilities, so use the vacancy’s deliverables and reporting line to understand what the job actually involves.
What Should a Data Analyst Portfolio Include?
Include a clear business question, an appropriate dataset, documented cleaning and validation, reproducible analysis and a concise recommendation. Explain uncertainty and limitations alongside the result. Public or synthetic data is suitable when labelled accurately, and confidential employer data should never be included without the necessary permission.
How Can a Data Analyst Show Impact Without Revenue Figures?
You can explain a decision improved, an error detected, a report made more dependable or time saved through a repeatable process. State the evidence and your contribution clearly. If an outcome was not measured, describe the delivered work and its use without inventing a numerical benefit.